


In early 2026, markets staged a sudden and severe repricing of enterprise software. Nearly $1 trillion in valuation had been wiped out by early February, and perhaps as much as $2 trillion including the subsequent weeks. The entire episode came to be dubbed the “SaaSpocalypse.” The immediate trigger for the sell-off is less important than the reality that it reflected growing market concerns about the potential encroachment of AI on long-run SaaS business models.
But the SaaSpocalypse was in many ways a confusing signal. SaaS equity prices have since returned to roughly pre-SaaSpocalypse levels (see below). While market valuations are by definition a prospective measure, they should in part be informed by recent actual performance. Plus, there’s the concern of whether the SaaSpocalypse shock itself affected SaaS revenues—for example, by making hiring or new funding rounds more difficult for these companies.
To help answer this question, we developed the Stripe SaaS Index, a weekly same-business measure of the health of nominal non-AI SaaS revenues, using Stripe pay-in volume.1 The flagship aggregate index covers an average of 72,000 businesses a week so far in 2026. Because it is a same-business index, the Stripe SaaS Index captures trends in the businesses themselves without being affected week-to-week by Stripe’s own market share or changes in the composition of businesses coming onto or off of Stripe. Because it is weekly, the Stripe SaaS Index can pick up on industry shifts before lower-frequency public data or quarterly financial reports. Further details are at the end of the post; we’ll be hosting and updating the indices on our website.
To be explicit, pay-in volume is not a replacement for an income statement. Our metric cannot see payments processed off Stripe or account for a business’s operating expenses and margins. It should instead be interpreted as a barometer for trends in gross SaaS demand that filters out Stripe-specific factors.
Overall SaaS revenue growth actually accelerated through the SaaSpocalypse
The Stripe SaaS Index tells several narratives about the SaaSpocalypse and its aftermath. First, recent SaaS revenue growth has remained strong and even accelerated from its end-2025 pace. This is clearest in the year-on-year change, which is now above 30%, at or above the prior highs that prevailed in the summer of 2023. Higher-frequency growth is more volatile but so far appears to be trending higher throughout 2026, especially at 13- and 26-week cadences.
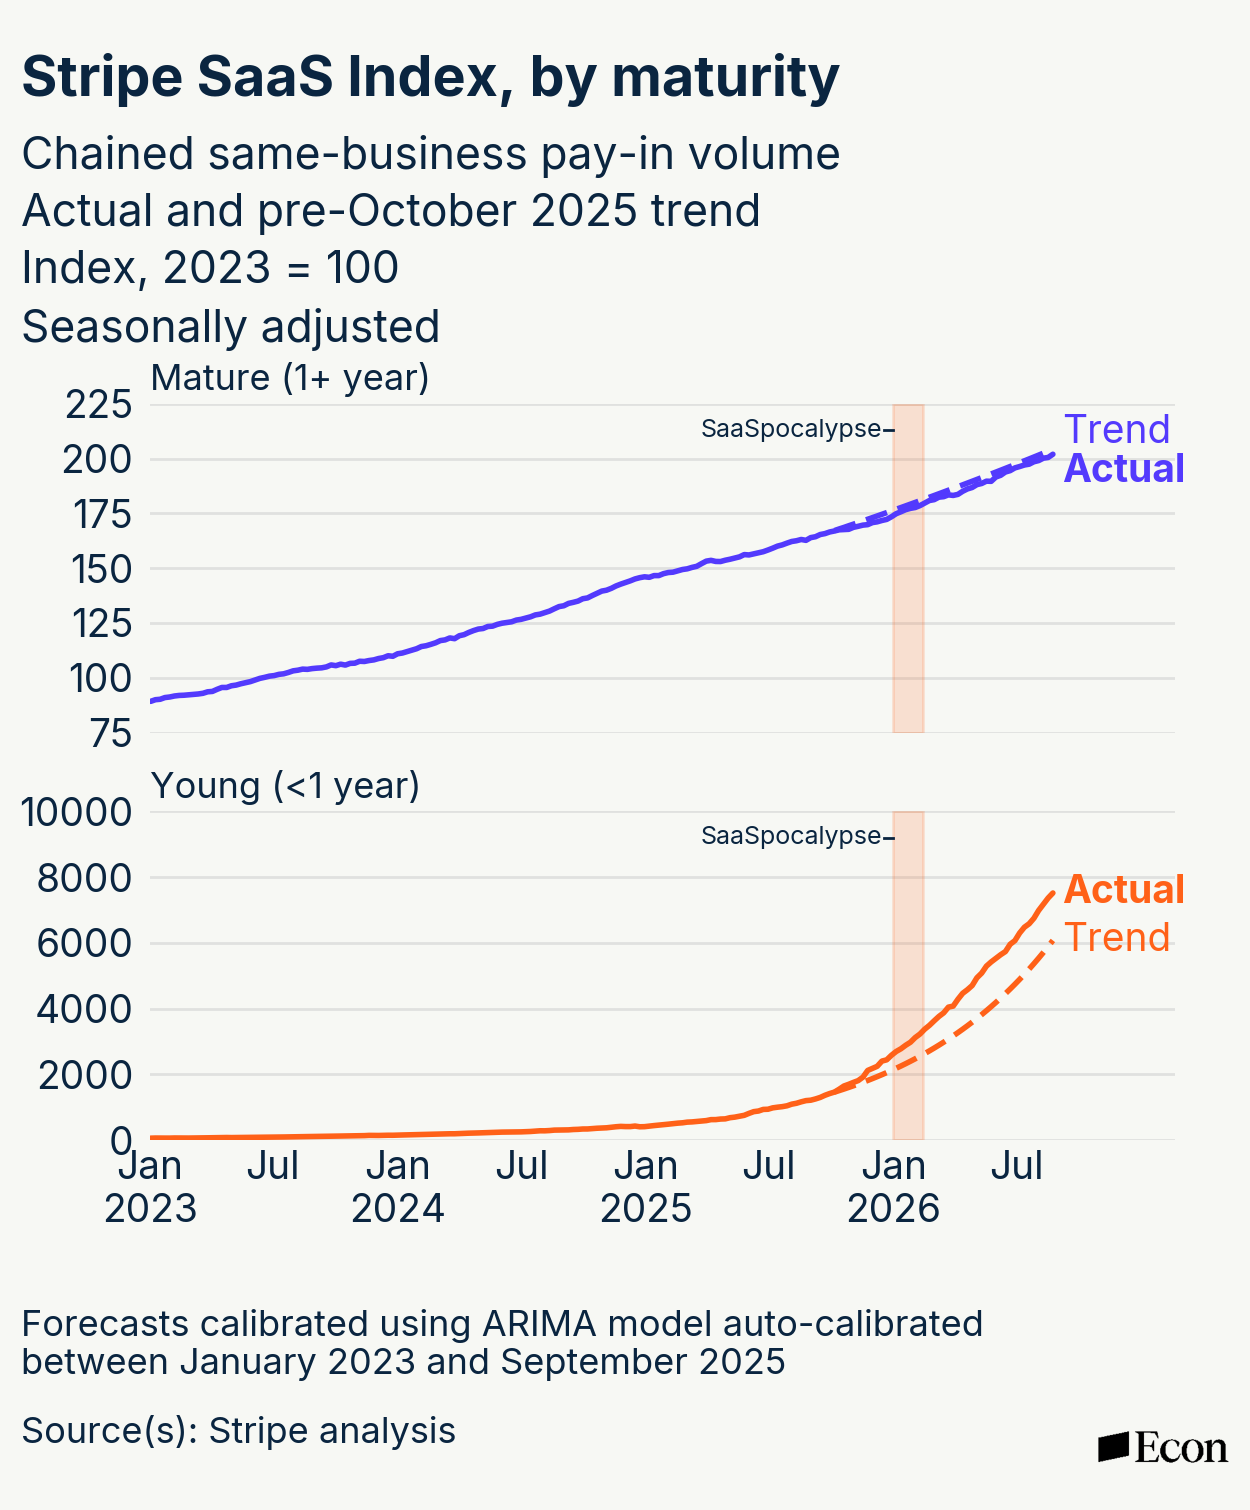
Another way of illustrating this is with the level of the Stripe SaaS Index—which shows cumulative growth rates over time. The index’s level has shifted above its pre-SaaSpocalypse trend and is now 4% higher. Between the beginning of May 2025 and the end of December, the index grew 14%, indicating solid same-business nominal revenue growth on average. Since January, the index has grown another 21% over the same length of time. This does not necessarily mean the market reaction in early 2026 was irrational or won’t show up eventually in medium-term SaaS revenues, but it does suggest the market reaction was almost entirely prospective and so far of little relevance to the short-run prosperity of SaaS firms.
This growth resilience was partially driven by larger firms…
Second, some but not all of the resilience story is about large SaaS businesses weathering the market shock. To test how typical the growth of our flagship indices are, we constructed an alternative index chained using equal-weighted median pay-in volume growth among SaaS businesses. Like our aggregate indices, the median index is same-business and resilient to changes in the composition of businesses on Stripe, but because it is unweighted, it is less indicative of the SaaS industry in aggregate and more reflective of the typical SaaS business, regardless of size. The story with our median index is different from the aggregate index: the typical SaaS business did in fact see a slowdown in weekly revenue growth during the market-sell-off, a slowdown that appears to have begun in late 2025. Once the early 2026 sell-off ended, however, typical growth reaccelerated sharply above its 2025 pace—such that cumulatively, our median index is now right back in line with its pre-SaaSpocalypse trend.
…but young SaaS businesses saw extraordinary acceleration
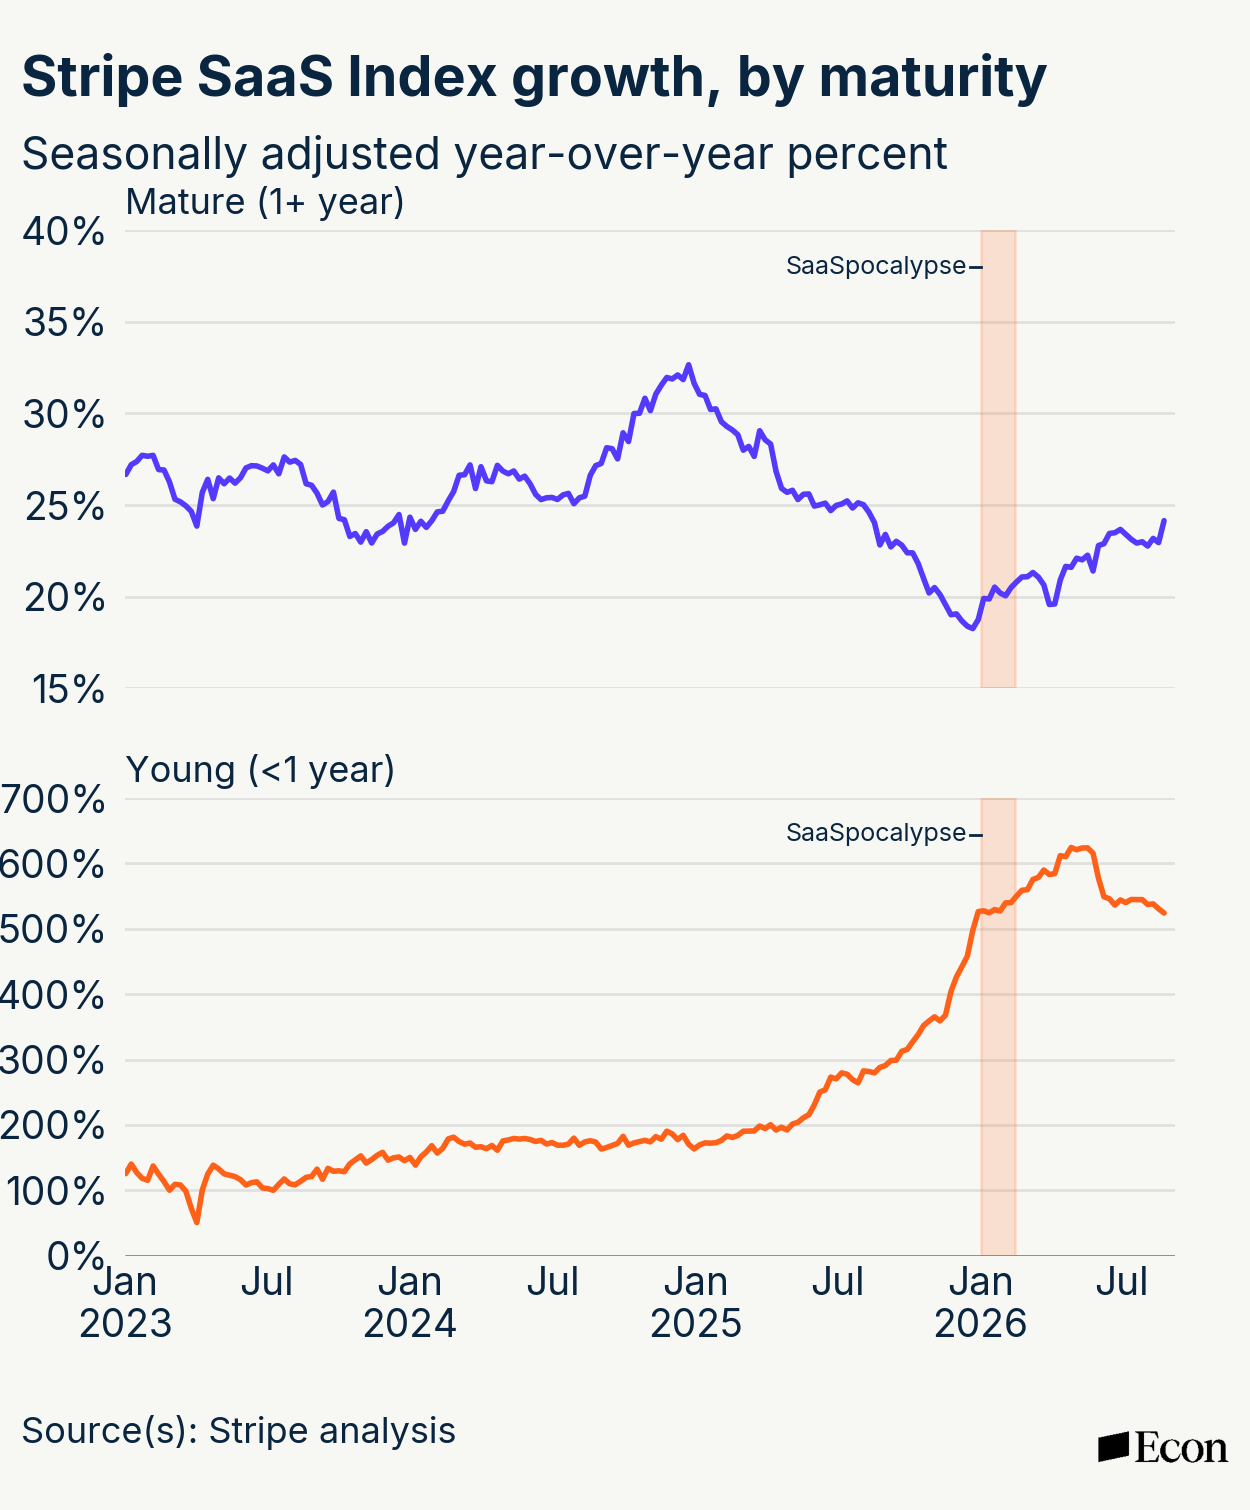
Third, young SaaS businesses saw particularly fast growth on average. While both young SaaS businesses (less than one year since their first Stripe charge) and mature SaaS businesses (one year or greater) accelerated though the SaaSpocalypse, the two entered the sell-off under different contexts. Young SaaS firms saw revenue growth rise sharply beginning in mid-2025; it kept accelerating throughout the SaaSpocalypse. Only recently has young SaaS revenue growth started cooling modestly, but growth remains well-above its 2025 pace. Mature SaaS in contrast saw its revenues accelerate in late 2024 and early 2025, and then begin the decelerate in late 2025 before the sell-off. The SaaSpocalypse if anything arrested this deceleration and hosted a resurgence in mature SaaS growth, now back to roughly its mid-2025 pace. Both patterns are the exact opposites of what we would expect if there were a SaaSpocalypse-driven retrenchment, and the strong performance of young SaaS businesses is, if anything, a positive harbinger of SaaS over the short and medium term.
Part of what might explain the recent relative acceleration for young businesses is a jump in AI usage. While Stripe can’t see all AI usage by a business, we do see certain signals such as Model Context Protocol (MCP) requests, agentic CLI requests, and sandbox claims. This proxy adoption has been rising gradually for both young and mature SaaS businesses. As recently as the beginning of 2026, proxy adoption—measured as the presence of at least one of our AI signals as a share of businesses—was five percentage points higher for mature SaaS. But then the gap closed rapidly, and it flipped in April. Now, young SaaS firms are four percentage points more likely to use Stripe AI tools than mature ones.
US SaaS has sustained its SaaSpocalypse acceleration
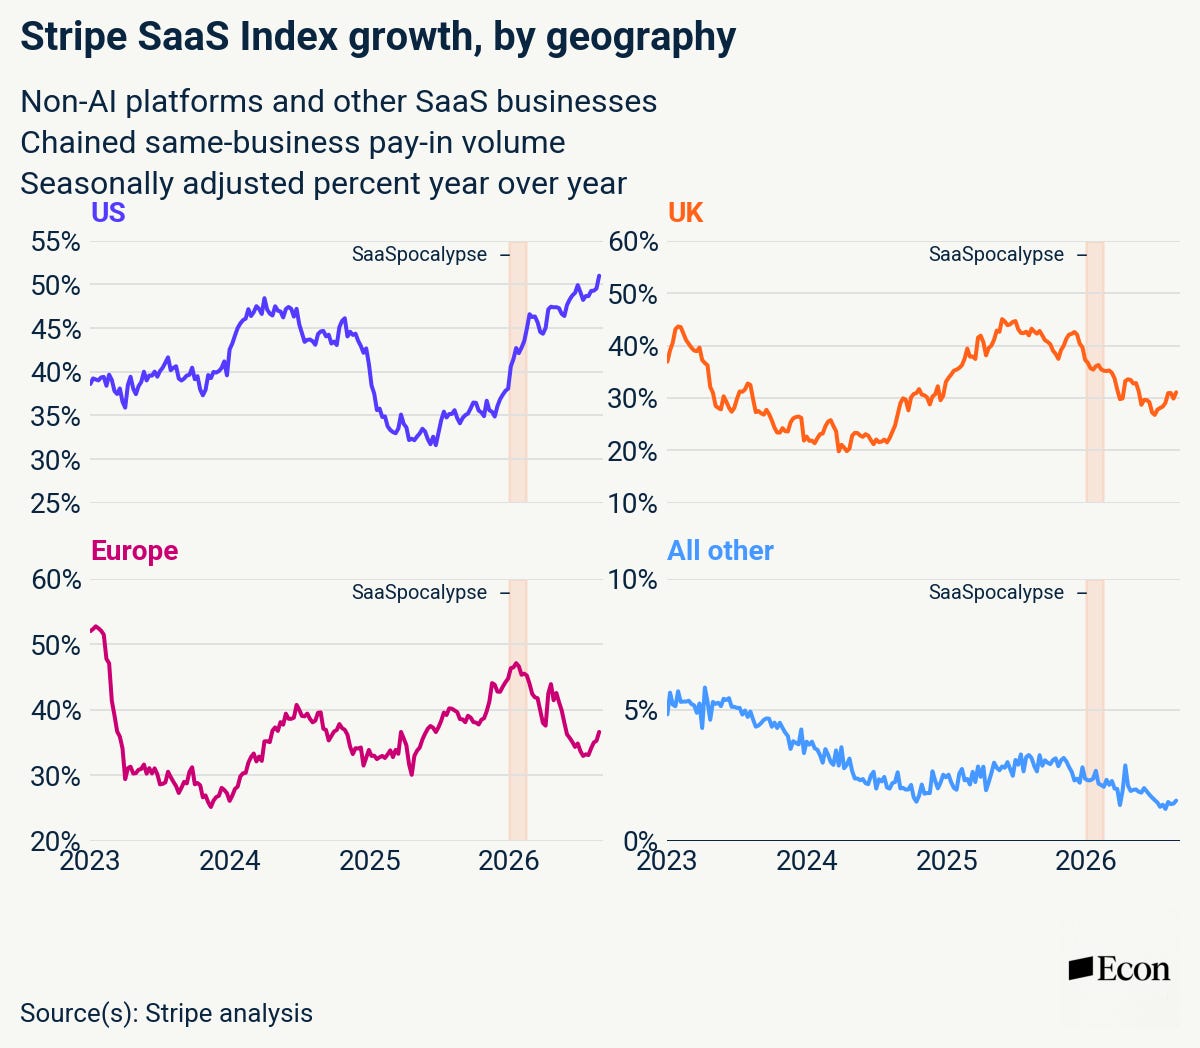
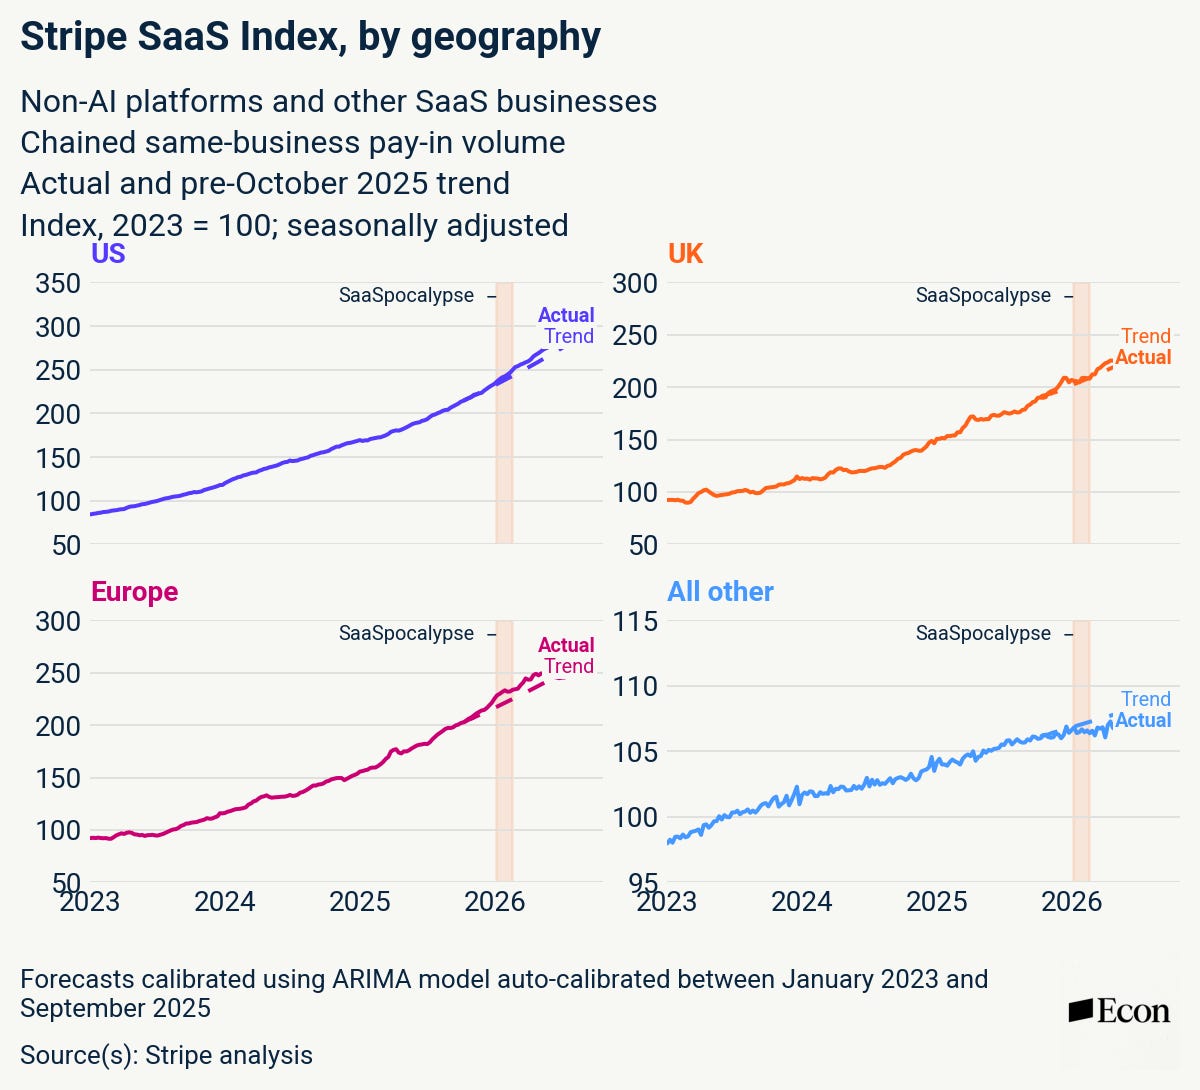
Fourth, there are notable geographic differences. After a 2025 that saw somewhat slower growth than 2024, the US saw clear acceleration going into the SaaSpocalypse, bringing growth rates back to 2024 levels and, more recently, even above. Cumulative US growth is slightly above its pre-October 2025 trend. Europe meanwhile accelerated into the market sell-off but has not sustained those higher growth rates, instead returning back to around growth rates that prevailed in late 2024 and early 2025. Nevertheless, Europe too is cumulatively above its pre-sell-off trend. The UK and the rest of the world saw growth peak in the summer of 2025 and gradually cool from there, with no clear discontinuity around the SaaSpocalypse. Cumulative UK growth is slightly above trend while it’s slightly below for the rest of the world.
Healthcare, retail, and professional services saw particular strength
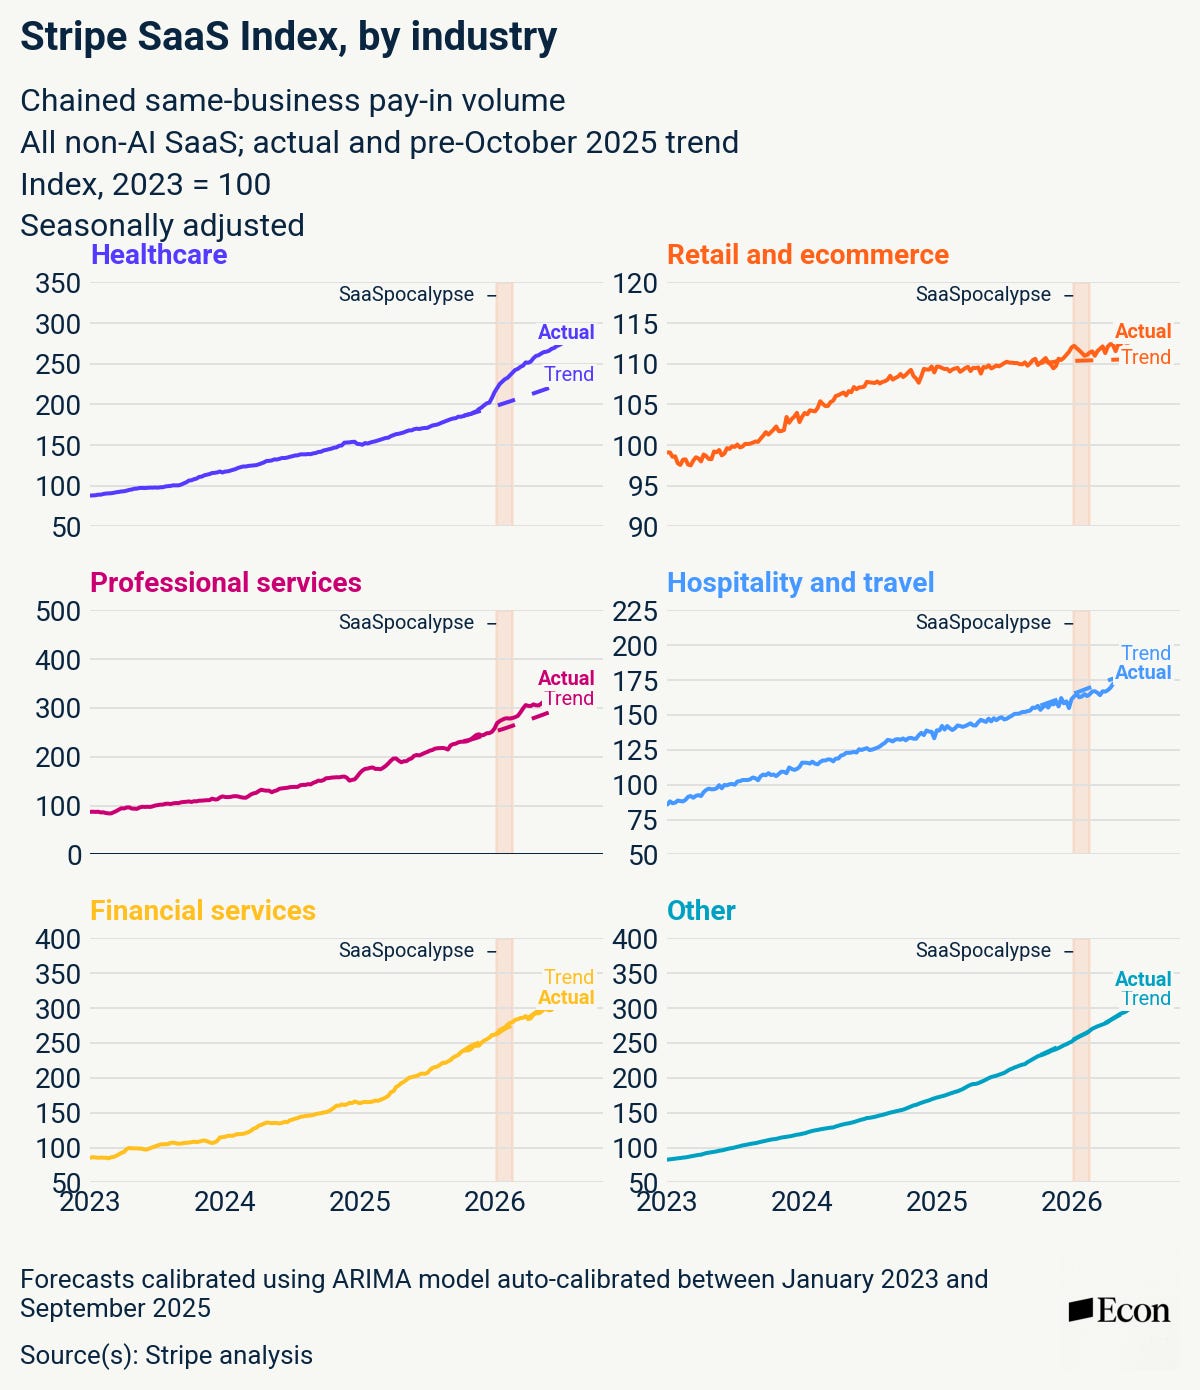
Fifth, there are some key industry-level differences within SaaS. Healthcare accelerated sharply through the SaaSpocalypse, while retail and professional services have also been beating their pre-sell-off trends, but by smaller margins. Financial services and other sectors are in line with trend. Broadly speaking, SaaS revenues appear to have been resilient post-SaaSpocalypse across sectors.
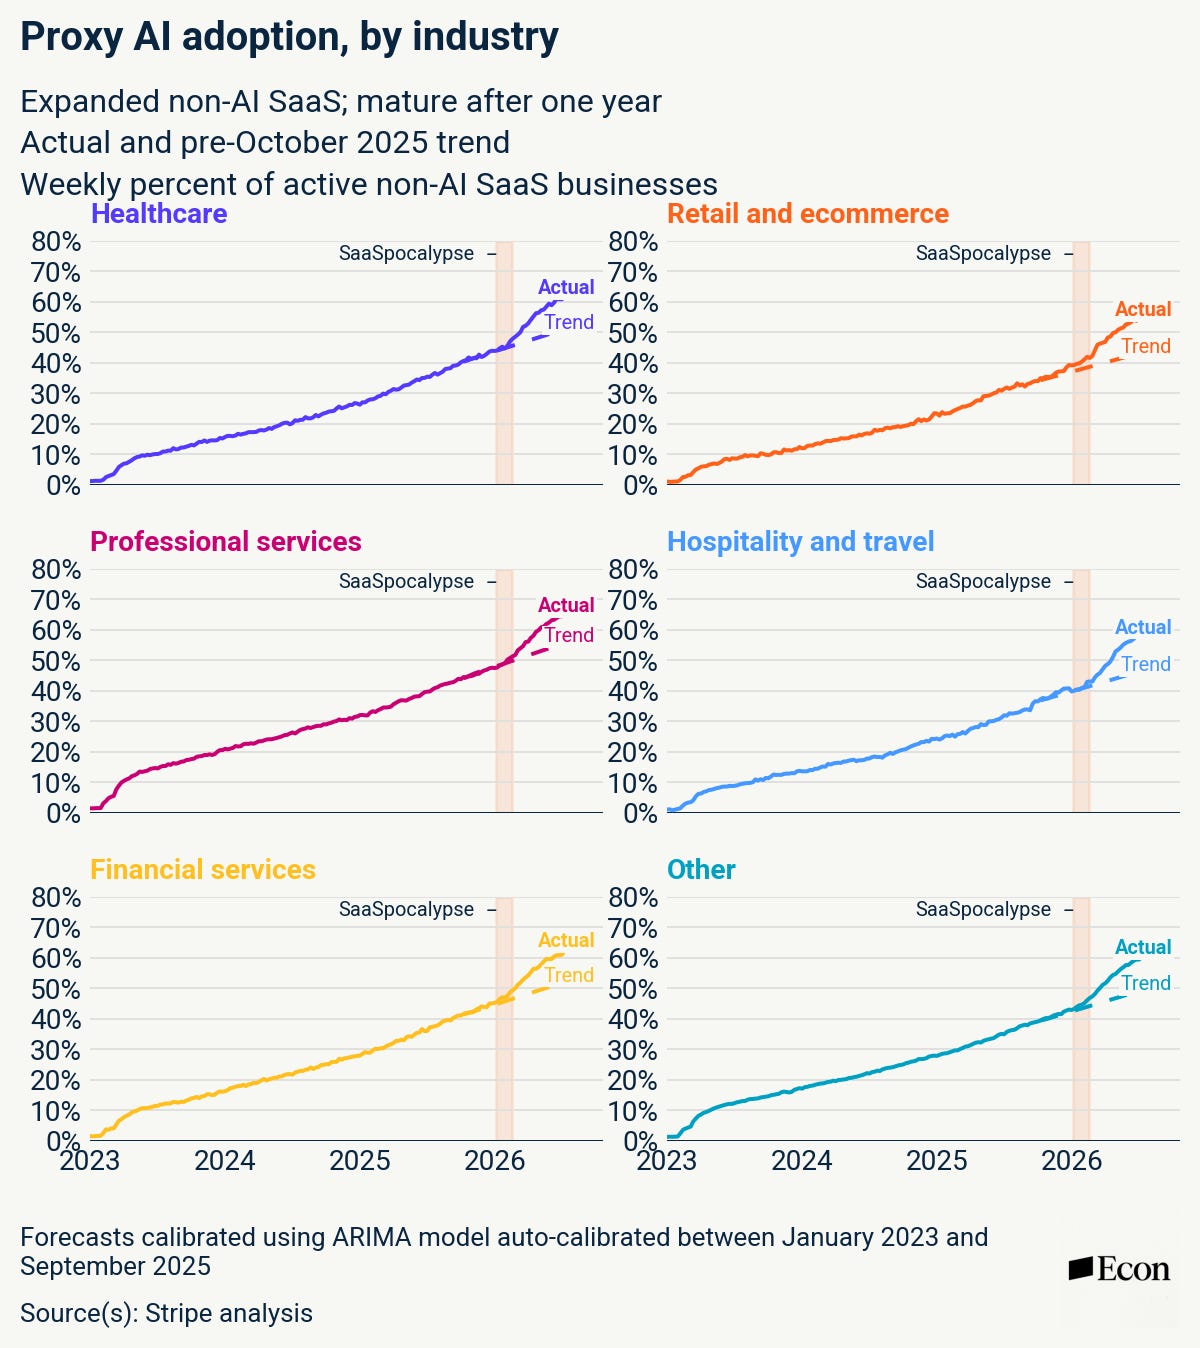
One area where we do not see wide differences by industry since the SaaSpocalypse has been proxy AI adoption, suggesting this measure alone cannot explain the growing healthcare wedge in 2026.
Our goal is that the Stripe SaaS indices prove a helpful tool for evaluating the real-time health of the industry. Markets are forward-looking and fast-changing, so only time will tell how ongoing demand and valuations interact with one another. In the meantime, we will be following our metrics and others’ closely, and we aim to publish other Stripe-based metrics on related topics in the near future.
Methodology
The Stripe SaaS Indices are weekly indices of pay-in volumes (customer payments) received by non-AI SaaS companies and processed through Stripe. The aggregate indices—our flagship index and the subindices by geography and industry—are Fisher indices: that is, geometric means of week-to-week pay-in volume growth of the sample of companies that appear in weeks T-1 and T, respectively, and chained over time, making them compositionally-adjusted same-business indices. Thus, week-to-week fluctuations do not reflect entry or exit of businesses on Stripe. We further filter out effects of rapid ramp-up and ramp-down on Stripe by winsorizing (capping) extreme outlier contributions to growth. The median index is not a Fisher index, but rather the unweighted median growth rate of SaaS businesses with nonzero pay-in volume in both weeks T-1 and T; otherwise, it is chained, seasonally adjusted, and averaged similar to the aggregate indices. Underlying pay-in volume is in US dollars using a fixed-period exchange rate; this means weekly index fluctuations also do not reflect currency movements. We seasonally adjust the weekly indices and apply a Kalman filter to remove volatility.
SaaS businesses include both platforms and non-platforms. AI businesses for data purposes reflects Stripe’s best efforts to identify AI-native firms building AI products, not just any business that employs AI tools. It reflects both manual and automated classification by both Stripe and the business itself.
Excellent breakdown! As a Senior Developer, I can absolutely confirm that robust RAG architectures and automated pipeline scaling are at their absolute peak right now.
Due to a recent shift in my technical focus, I’m actually offloading full Intellectual Property (IP) ownership rights to my production-tested 4-in-1 FastAPI Backend Suite (featuring an AI Meeting Summarizer, Auto-Social Poster, Reputation Manager, and a programmatic SEO engine).
It completely bypasses 3+ months of engineering cycles and is ready to deploy as a premium white-label asset. Selling the entire bundle (modular codebase +domain) for a flat fee of $8,000 via secure Escrow.
If any agency owners or technical directors here want to save thousands in development overhead and upscale your B2B offers instantly, feel free to drop a reply or send me a direct message!
$VERX
The only SaaS name still not bounce back